redis-cluster
most important lesson from years of distributed systems:
keep everything on a single machine for as long as humanly possible
— @sarna_dev
I recently read Tales of the Tail: Hardware, OS, and Application-level Sources of Tail Latency. The paper argues that opaque (to the application developer!) sources of latency can lead queuing models to overpredict the efficacy of multi-core systems. Throughout the bulk of the paper, the authors introduce and then suggest ways to mitigate common sources of model-breaking latency. Redis is one such system that’s known to scale poorly when naively configured on multi-core VMs because of its single-threaded design. This presents a challenge: how can we provision a big CPU-optimized box to act as a high-performance, single-node cache?
By provisioning CPU cores to minimize scheduler contention, io thread
interference, and benchmark client saturation, I was able to hit
ZRANGE/ZADD ops/sec using redis-cluster on a
single DigitalOcean droplet. Scaling is (of course) sublinear,
but with a high exponent (~0.92), suggesting that for CPU-heavy
workloads with no cross-shard ops, a well-sharded redis-cluster on a
single node provides sufficient CPU headroom for many applications.
| nshard | k-ops/s. | k-ops/cpu | p99ms | scale | p | |
|---|---|---|---|---|---|---|
| 1 | 1,984 | 1,984 | 52.5 | - | - | |
| 4 | 6,647 | 1,662 | 119.8 | 3.35 | 0.87 | |
| 8 | 13,141 | 1,643 | 119.3 | 6.62 | 0.92 | |
| 16 | 20,558 | 1,285 | 166.9 | 10.36 | 0.84 | * |
| 32 | 20,690 | 647 | 276.5 | 10.43 | 0.68 | * |
| nshard | k-ops/s. | k-ops/cpu | p99ms | scale | p | |
|---|---|---|---|---|---|---|
| 1 | 1,997 | 998 | 53.5 | - | - | |
| 4 | 6,854 | 857 | 118.3 | 3.43 | 0.89 | |
| 8 | 13,108 | 819 | 118.3 | 6.57 | 0.91 | |
| 16 | 20,247 | 633 | 166.9 | 10.14 | 0.84 |
| nshard | k-ops/s. | k-ops/cpu | p99ms | scale | p | |
|---|---|---|---|---|---|---|
| 1 | 1,964 | 491 | 74.4 | - | - | |
| 4 | 6,740 | 421 | 69.1 | 3.43 | 0.89 | |
| 8 | 11,414 | 357 | 89.6 | 5.81 | 0.85 |
Fig. 1.1–1.3 — Throughput is modeled as , where ; a value of 1.0 represents perfect linear scaling. Sub-linear scaling at low shard counts reflects intra-shard coordination overhead. For tests marked with an asterisk, the benchmark client CPU saturates before Redis, artificially reducing the scaling exponent. These figures may represent a lower bound on Redis’s actual scaling efficiency at that configuration, though an alternative test framework would be needed to realize the true scaling exponent. Regardless, we see a consistent pattern; relative performance is a function of the number of shards rather than the number of total cores available.
I ran all tests on a DigitalOcean c-60-intel droplet
running ubuntu-24-04-x64 with 60 vCPUs and 120 GB RAM. The
benchmark client and server replicas ran on the same node and were
isolated to their respective CPU core ranges via taskset.
All charts were generated by analyzing the output of a Rezolus process
recording the node during the benchmark runs.
I used memtier-benchmark as a load generator and
prepared a workload of 90:10 ZRANGE/ZADD commands. The
keyspace contained 64M keys and used 1-byte values. This specific set of
parameters was designed to be adversarial to the Redis server.
Small
s
are cheap to generate and send back and forth over loopback, while
ZRANGE 0 -1 forces an expensive scan over the sorted set’s
internal skiplist.
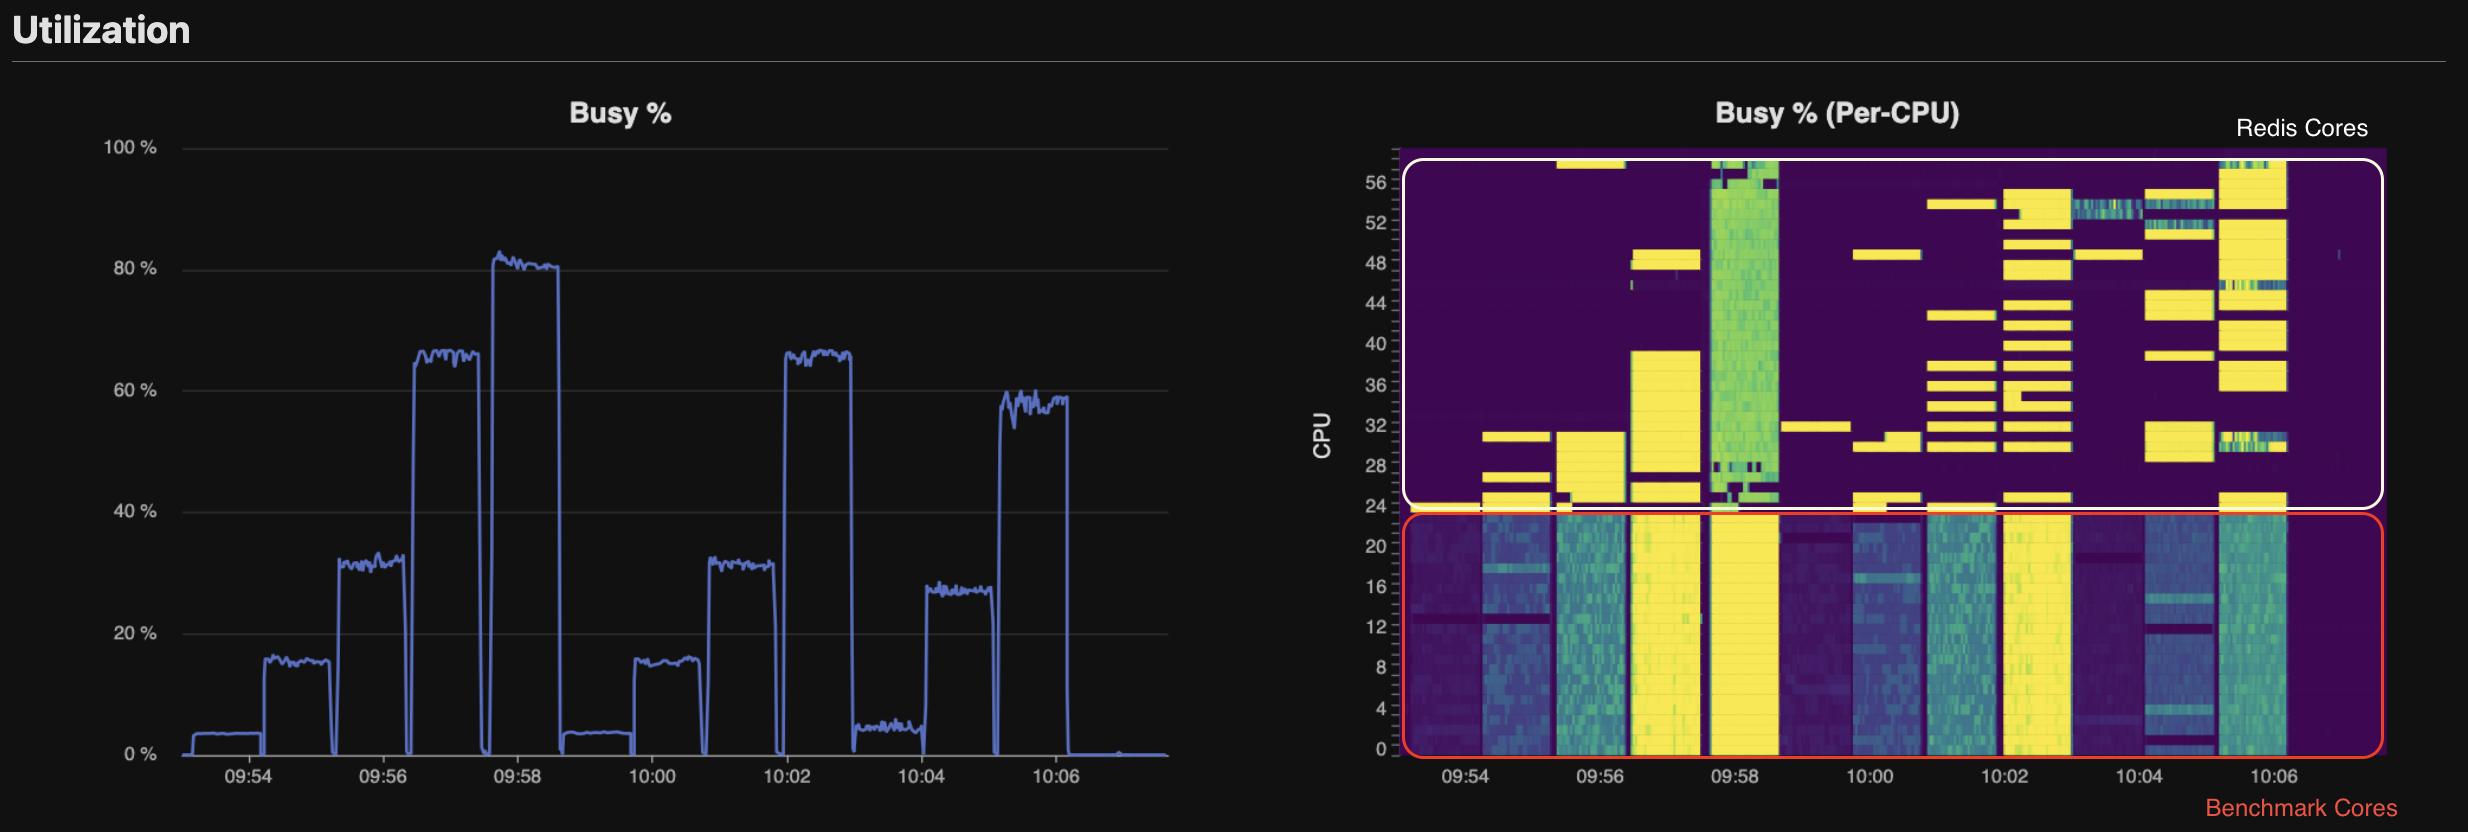
Fig. 2 Per-CPU Utilization — Redis cores’ utilization is sparse and depends on whether the core is assigned to command processing or . We observe that total CPU load peaks above during tests involving Redis cores. But we should be careful! This number alone can be misleading, and analysis of CPU by cgroup shows that Memtier, not Redis, is CPU saturated.
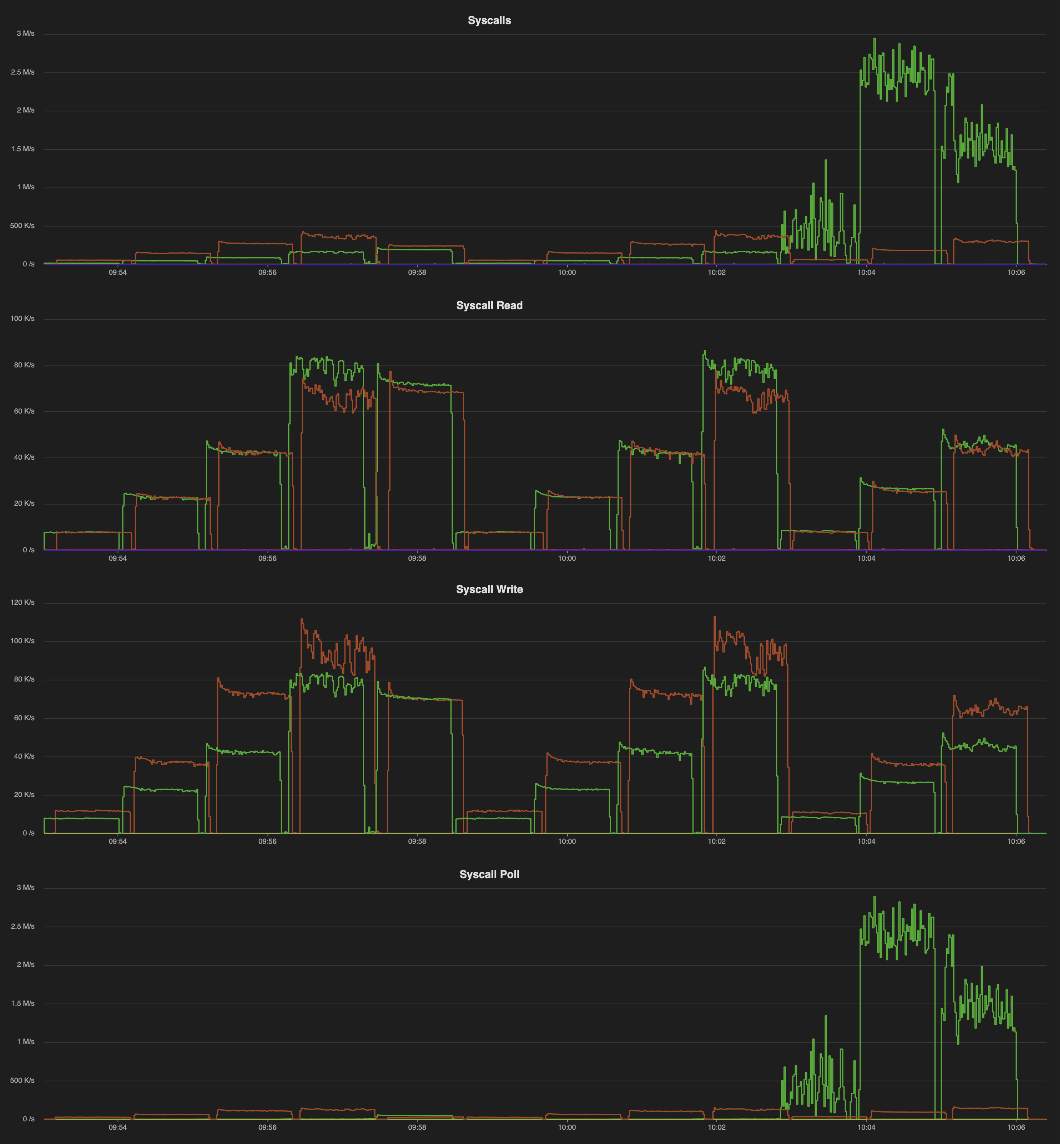
Fig. 3 Syscall Activity — read and write
syscalls scale linearly with shard count and are roughly balanced
between the client (orange) and server
(green). However, very few
poll calls are made until the high CPU/shard begin at
10:03. When each shard is given more than 1 dedicated io thread, they
spin on epoll_wait. For our test, there is very little
needed, and these cores are largely wasted. Additional testing would be
needed (from a second VM) to determine whether a single io thread is
sufficient, or if the 4 CPU/shard configuration is beneficial for
workloads with larger keys.
So where does this leave us? For tests with
shards, the client saturates before Redis. When that happens, we see
increased write syscall latency (p50:
),
a spike in TLB flushes, and frequent context switching. That said, I’m
willing to concede that
20M ops/sec may simply be the ceiling for this benchmarking
configuration.
For CPU-heavy workloads with no cross-shard operations, there’s a clear practical takeaway: more shards beat more cores per shard. What makes these multi-shard configurations appealing (through at least 8 shards) is the low dropoff () relative to the standard 1CPU configuration. By carefully matching our hardware to our application and workload shape, we’ve shown that a single large VM can support a very capable Redis deployment. Although this setup introduces additional operational complexity relative to a managed KV store, the scaling model suggests that single-node, multi-shard Redis clusters are sufficient for many caching workloads.
— I am not the first person to figure this out. In 2019, Redis Labs achieved 200M ops/sec on a distributed cluster of 2800 cores (see: blog). My test shares with the Redis Labs test. However, it’s interesting that both tests 1. took advantage of CPU affinity to run multiple shards/node and 2. found that 8 shards/node was the “sweet spot”. In Valkey Turns One: How the Community Fork Left Redis in the Dust, Momento ran a head-to-head test of Valkey 8.1 vs Redis 8.0, their tests also implemented CPU affinity methods to improve performance.